
Proxy Data Undergraduate Research: Joshua Anderson
Working in the IsoLab as a lab tech has served as the perfect experience to pair with my Earth and Space Sciences (ESS) education and my independent research project as an undergraduate student at UW. For the last year and a half, I have become familiar with the day-to-day processes of the hands-on laboratory work required to advance exciting earth science research. As a lab tech, I help prepare samples, operate mass spectrometers, and contribute to data analysis. These tasks are unique to every project, which requires constant collaboration and problem-solving. My conversations with fellow lab techs and the lab manager, Andrew Schauer, have provided for me perhaps the single most useful lesson of my undergraduate education for understanding geochemistry topics and the scientific method. Not only have I worked with members of the UW community, but I have assisted in many sample analysis projects sent to our lab by stakeholders and scientists from around the globe. From Puget Sound fishes to chondrites, I am exposed to a plethora of samples that we can learn from by use of stable isotope geochemistry. The use of proxy data, natural recorders of climate, eventually became the focus of my undergraduate research - a piece of an ongoing and much larger scope project led by professor Eric Steig and graduate student Jessica Badgeley. I presented my research at the poster presentation section of the 2018 UW Earth and Space Sciences Research Gala
Natural records of climate, such as ice cores, corals, and tree rings - also known as proxy data - allow earth scientists to estimate components of past climate, such as precipitation and temperature. Proxy data provide information through time at specific locations, but they are spatially incomplete. Numerical models, on the other hand, provide a “solution” everywhere and reflect the known physics of ice sheets and climate, but do not necessarily capture what we understand and observe in proxy data. While most research has relied on either models or proxy data, our data assimilation approach attempts to synthesize and bring these tools together in order to derive a more independent and accurate estimate of Greenland Ice Sheet climate. Our Greenland climate reconstruction, which will cover the Holocene Thermal Maximum warming period roughly 8,000 to 5,000 years ago, can be used as a more precise climate forcing for ice sheet models that aim to improve our understanding of how future climate change will affect ice sheet melting and rising sea levels. My goal is to optimize the use of globally-available proxy records in our data assimilation approach by testing distance and correlation relationships in globally-available temperature data. By comparing PAGES2k proxy data (figure 1), GISTEMP (GISS Surface Temperature Analysis) modern estimate of surface temperature change since 1880, and CCSM4 (The Community Climate System Model 4.0) coupled model output temperature data over the last 1,000 years, my results indicate that we will likely be able to quantitatively show how to effectively use all types of available proxy data records to best reconstruct past climate over the Greenland Ice Sheet.
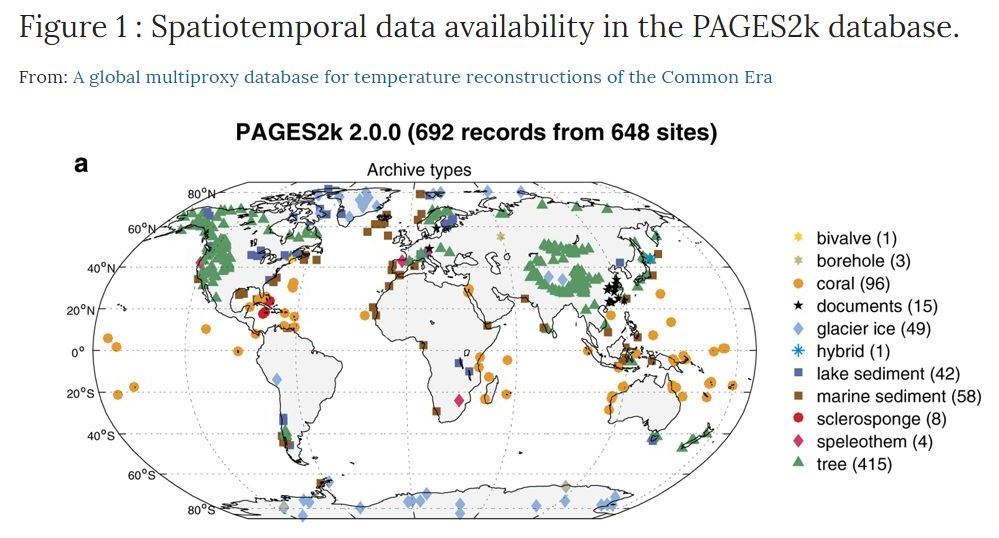
PAGES2k Consortium, Scientific Data volume 4, Article number: 17088 (2017)
By choosing a location in central Greenland (drilling an imaginary ice core), and comparing its temperature and proxy data correlation to locations around the globe (using the GISTEMP, CCSM4, and PAGES2k data sets), I aim to quantitatively describe what proxy data is most useful to describe Greenland Ice Sheet paleoclimate. My research continued after presenting at the ESS research gala in March of 2018, primarily focusing on detrending temperature data to remove the influence of modern anthropogenic climate change.
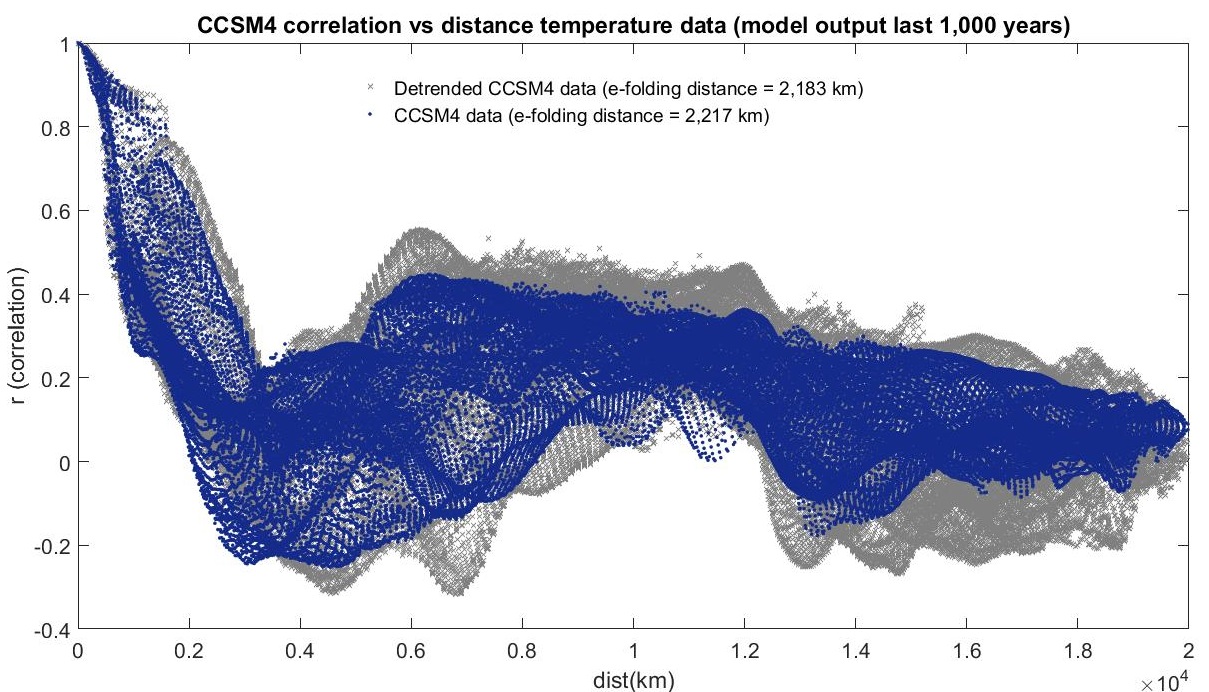
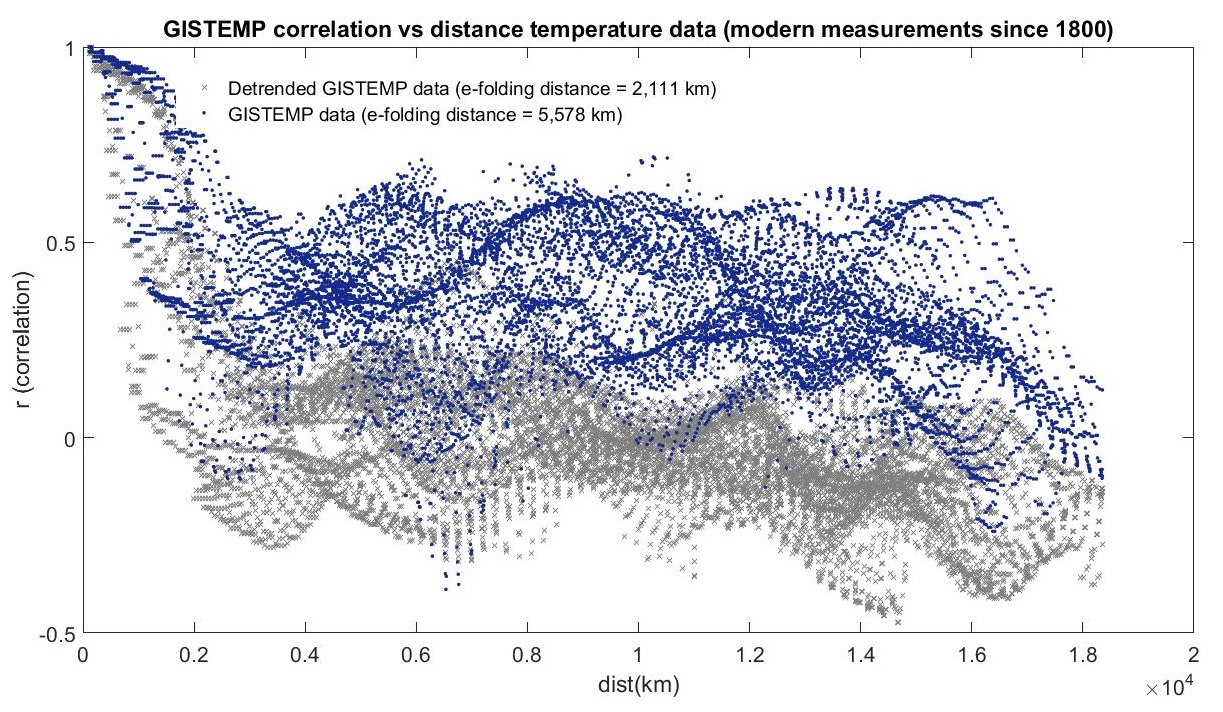
Figures 2 & 3: Raw data vs detrended data for the CCSM4 and GISTEMP data sets respectively. Note that correlation significantly drops for GISTEMP data after detrending, likely from the influence of modern anthropogenic warming.
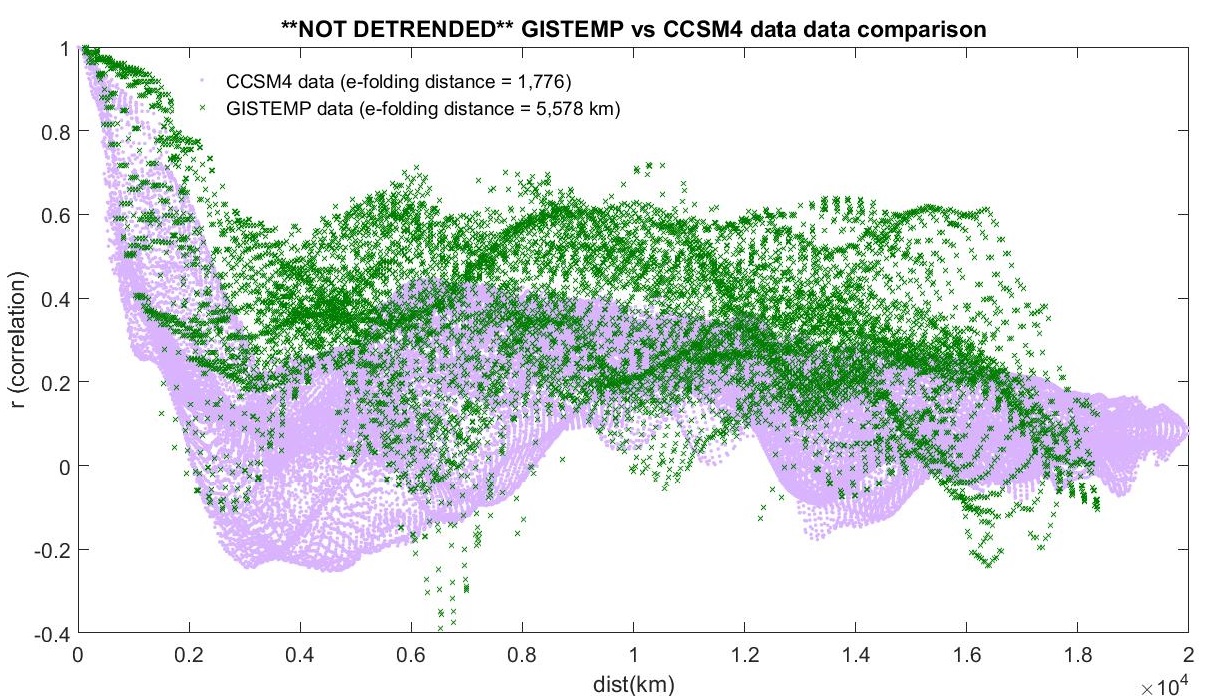
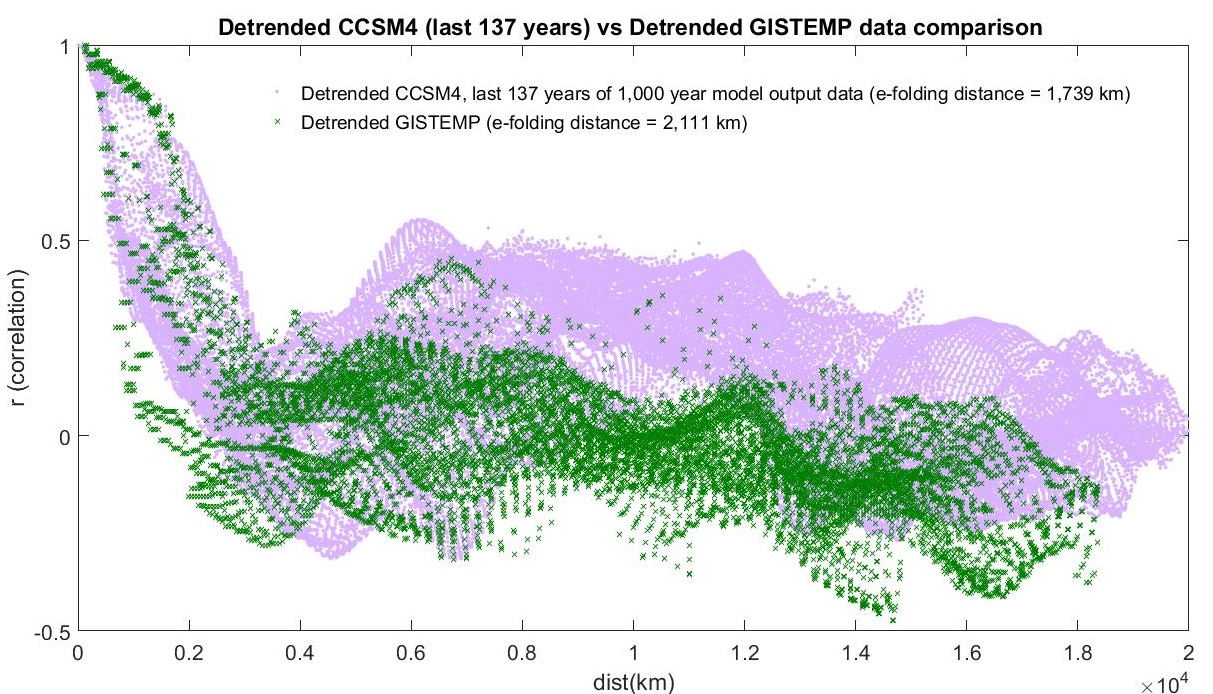
Figures 4 & 5: The same information as figures 2 & 3, but presented now as a side by side comparison of raw data and detrended data for the different data sets.
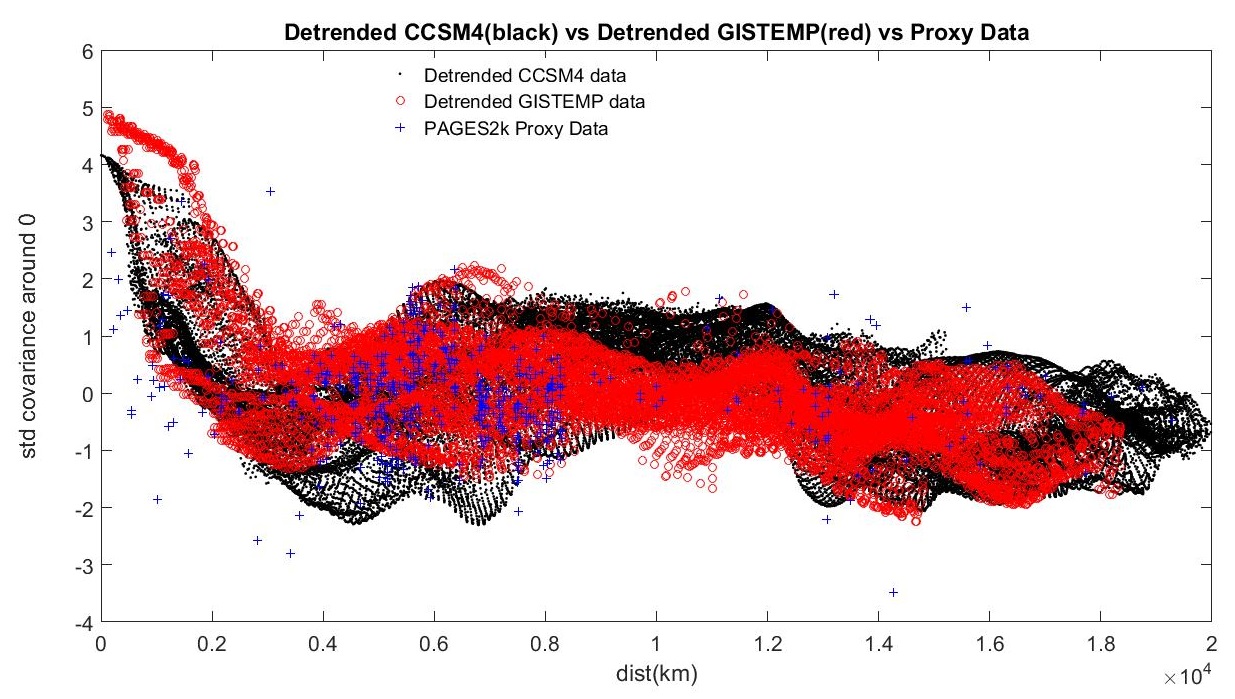
Figure 6: A common covariance scale with an arbitrary y-scale manipulated from their correlations, this plot is a direct comparison of detrended CCSM4 model output, GISTEMP modern temperature data, and PAGES2k proxy data. All three types of data display similar characteristics for correlation at a distance away from central Greenland